Note
Click here to download the full example code
Authomatic computation of the transition frequency
This example shows how to use transfreq for computing the alpha-to-theta transition frequency when only resting-state data are available. The result is compared with that obtained by using the classical Klimesch’s method.
import mne
from transfreq import compute_transfreq_klimesch, compute_transfreq
from transfreq.viz import (plot_transfreq, plot_transfreq_klimesch,
                           plot_clusters, plot_channels)
from transfreq.utils import read_sample_datapath
import os.path as op
import numpy as np
import matplotlib.pyplot as plt


# Define path to the data
subj = 'transfreq_sample'
data_folder = read_sample_datapath()
f_name_rest = op.join(data_folder, '{}_resting.fif'.format(subj))
f_name_task = op.join(data_folder, '{}_evoked.fif'.format(subj))

# Load resting state data
raw_rest = mne.io.read_raw_fif(f_name_rest)
raw_rest = raw_rest.pick_types(eeg=True, exclude=raw_rest.info['bads'] + ['TP9', 'TP10', 'FT9', 'FT10'])

# Load data recorded during task execution
raw_task = mne.io.read_raw_fif(f_name_task)
raw_task = raw_task.pick_types(eeg=True, exclude=raw_task.info['bads'] + ['TP9', 'TP10', 'FT9', 'FT10'])

# List of good channels
tmp_idx = mne.pick_types(raw_rest.info, eeg=True, exclude='bads')
ch_names_rest = [raw_rest.ch_names[ch_idx] for ch_idx in tmp_idx]

tmp_idx = mne.pick_types(raw_task.info, eeg=True, exclude='bads')
ch_names_task = [raw_task.ch_names[ch_idx] for ch_idx in tmp_idx]

# Define time range. The length of both recordings is set equal to the length of
# the shortest one. In this way we obtain the same frequency resolution when
# computing the corresponding power spectra by using the multitaper method.
# This is required for applying the Klimesch's method
tmin = 0
tmax = min(raw_rest.times[-1], raw_task.times[-1])

# Compute power spectra
n_fft = 512*2
bandwidth = 1
fmin = 2
fmax = 30

sfreq = raw_rest.info['sfreq']
n_per_seg = int(sfreq*2)

psds_rest, freqs = mne.time_frequency.psd_multitaper(raw_rest, fmin=fmin,
                                                     fmax=fmax, tmin=tmin,
                                                     tmax=tmax,
                                                     bandwidth=bandwidth)

psds_task, freqs = mne.time_frequency.psd_multitaper(raw_task, fmin=fmin,
                                                     fmax=fmax, tmin=tmin,
                                                     tmax=tmax,
                                                     bandwidth=bandwidth)

# Define channel positions
ch_locs_rest = np.zeros((len(ch_names_rest), 3))

for ii in range(len(ch_names_rest)):
    ch_locs_rest[ii, :] = raw_rest.info['chs'][ii]['loc'][:3]
Out:
Opening raw data file /home/sara/Documenti/San_Martino_Alzhaimer/transition_frequency/transfreq/data/transfreq_sample_resting.fif...
/home/sara/Documenti/San_Martino_Alzhaimer/transition_frequency/examples/plot_main_code.py:28: RuntimeWarning: This filename (/home/sara/Documenti/San_Martino_Alzhaimer/transition_frequency/transfreq/data/transfreq_sample_resting.fif) does not conform to MNE naming conventions. All raw files should end with raw.fif, raw_sss.fif, raw_tsss.fif, _meg.fif, _eeg.fif, _ieeg.fif, raw.fif.gz, raw_sss.fif.gz, raw_tsss.fif.gz, _meg.fif.gz, _eeg.fif.gz or _ieeg.fif.gz
  raw_rest = mne.io.read_raw_fif(f_name_rest)
    Range : 0 ... 29558 =      0.000 ...    59.116 secs
Ready.
Opening raw data file /home/sara/Documenti/San_Martino_Alzhaimer/transition_frequency/transfreq/data/transfreq_sample_evoked.fif...
/home/sara/Documenti/San_Martino_Alzhaimer/transition_frequency/examples/plot_main_code.py:32: RuntimeWarning: This filename (/home/sara/Documenti/San_Martino_Alzhaimer/transition_frequency/transfreq/data/transfreq_sample_evoked.fif) does not conform to MNE naming conventions. All raw files should end with raw.fif, raw_sss.fif, raw_tsss.fif, _meg.fif, _eeg.fif, _ieeg.fif, raw.fif.gz, raw_sss.fif.gz, raw_tsss.fif.gz, _meg.fif.gz, _eeg.fif.gz or _ieeg.fif.gz
  raw_task = mne.io.read_raw_fif(f_name_task)
    Range : 0 ... 61121 =      0.000 ...   122.242 secs
Ready.
    Using multitaper spectrum estimation with 57 DPSS windows
    Using multitaper spectrum estimation with 57 DPSS windows
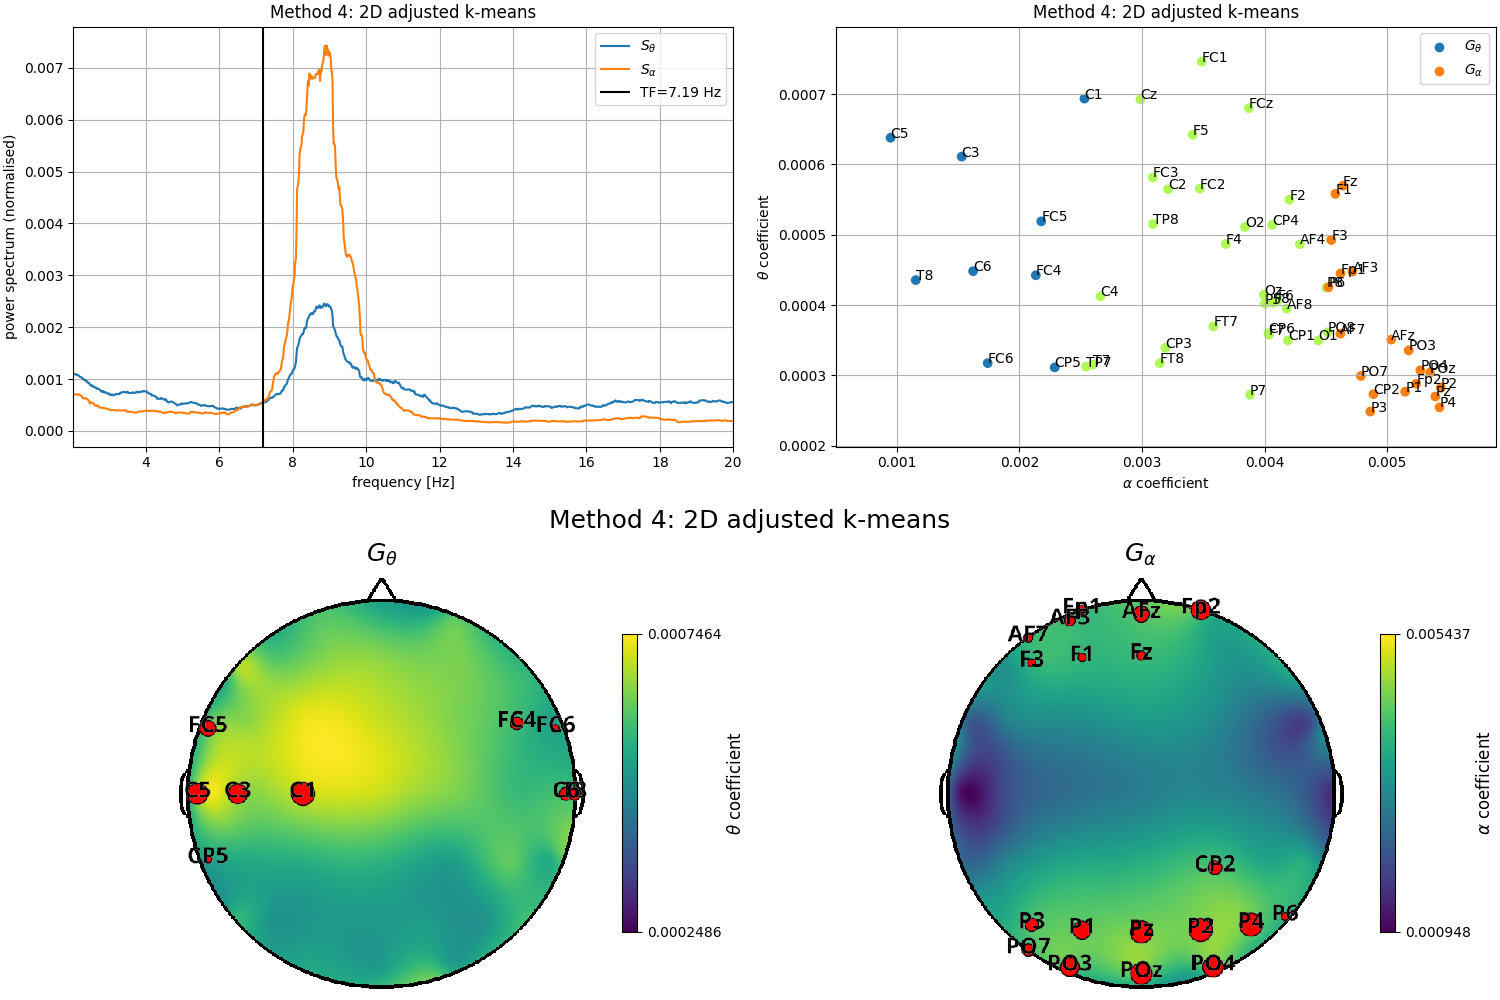
Compute the transition frequency with the default clustering method
tfbox = compute_transfreq(psds_rest, freqs, ch_names=ch_names_rest)
Plot results
fig = plt.figure(constrained_layout=True, figsize=(15, 10))
subfigs = fig.subfigures(2, 1, wspace=0.1)

ax1 = subfigs[0].subplots(1, 2)
# Plot estimated transition frequency
plot_transfreq(psds_rest, freqs, tfbox, ax=ax1[0])
# Plot results of the clustering approach
plot_clusters(tfbox, ax=ax1[1])
# Plot locations of the two channels groups
plot_channels(tfbox, ch_locs_rest, subfig=subfigs[1])
Out:
<matplotlib.figure.SubFigure object at 0x7fafa8930450>
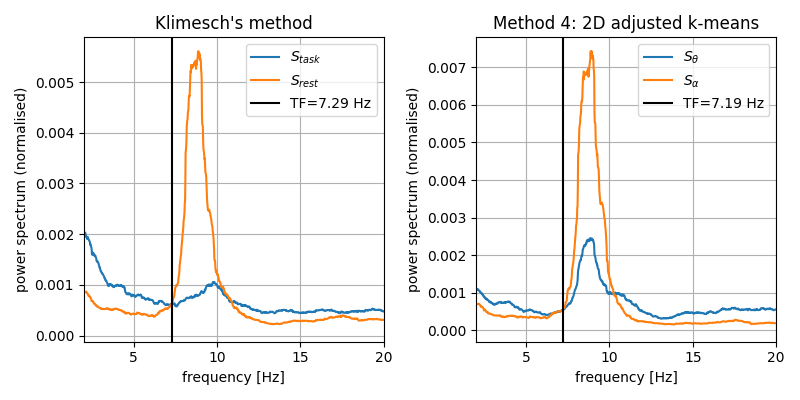
Compute results with Klimesch’s method
tf_klimesch = compute_transfreq_klimesch(psds_rest, psds_task, freqs)
Plot and compare the transition frequencies estimated with klimesch’s metod and with transfreq
fig, ax = plt.subplots(1, 2, figsize=(8, 4))
plot_transfreq_klimesch(psds_rest, psds_task, freqs, tf_klimesch, ax=ax[0])
plot_transfreq(psds_rest, freqs, tfbox, ax=ax[1])
fig.tight_layout()
Total running time of the script: ( 0 minutes 13.457 seconds)